By Eliza Owen, CoreLogic
The recently released ANZ CoreLogic Housing Affordability Report showed wide scale declines in housing affordability through the current upswing.
At the national level, the ratio of housing values to household incomes reached a new record high in June, as did the number of years it takes to save a deposit, and the portion of income required to pay rents.
While the portion of income required to service a mortgage was not at record highs due to low interest rates, it had increased over the past few quarters.
But the report also highlights the particularly strained conditions for buyers in regional Australia.
Affordability challenges in regional Australia have been exacerbated by the effects of COVID-19, where normalised remote work trends and appealing coastal or tree change settings became ‘pull’ factors of demand, while high capital city property prices, and the higher incidence of strict social distancing restrictions, became ‘push’ factors, driving people away from major cities.
In the year to March 2021, migration from cities to regions increased 5.9%, while the number of people leaving regional Australia for the capital cities declined 3.5% in the same period.
The combination of more people arriving in regional Australian and fewer people leaving for the cities has created additional demand for housing, pushing the number of homes available to buy or rent to extreme lows. As of 28 November, the amount of for sale listings counted across regional Australia remained -36.9% below the five-year average, with just under 60,000
properties available for sale.
The ANZ CoreLogic Affordability Report features analysis on around 130 regional SA3 sub markets.
The tables below show how affordability metrics across various SA3 markets of regional Australia have changed between March 2020, before the onset of COVID-19, and the latest metrics for June 2021.
For each of the four metrics used to assess affordability, the top 10 regions with
the biggest deteriorations have been highlighted.
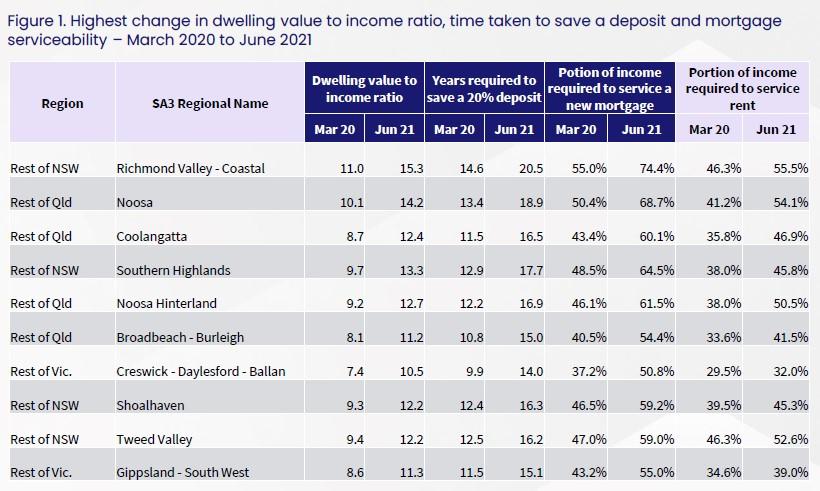
The dwelling value to income ratio measures the amount of time the median dwelling value in a region can be divided by the median annual household income.
Dwelling value to income ratios have risen most across the Richmond Valley-Coastal region of NSW since the onset of COVID-19, from 11.0 at March 2020 to 15.3 as of June 2021.
Between March 2020 and June 2021, dwelling values across the region have increased 34.3%, adding around $290,000 to the median value of a dwelling in this period.
This has also created the biggest rise in years required to save a 20% deposit (which reached 20.5 years at June 2021), and the portion of income required to service a new mortgage (which climbed to 74.4%).
It is unsurprising that this market has topped the list.
Reports on the Richmond Valley Coastal market, which includes Byron Bay,
document the area as subject to high levels of investment for short term holiday accommodation, and attracting residents on high incomes, which can lead to longer-term residents and local service workers being priced out.
In fact many of the areas on this list which have seen the biggest rise in metrics since COVID-19 have seen similar trends.
Another key component of these regional markets is that they were fairly unaffordable to begin with.
The biggest reduction in affordability has occurred across areas that were in the top 30 least affordable SA3 markets at the onset of the pandemic in
March 2020.
This reflects a broader trend through the current upswing, which is that higher value areas have tended to see higher annual dwelling value growth rates.
Alongside affordability metrics around purchasing, the portion of income required to service rent has also jumped significantly in some parts of regional Australia.
The biggest increase in this measure since the onset of COVID-19 is shown in figure 2 below.
These areas are largely in Queensland, with only the Richmond Valley Coastal region making the top 10 list for NSW.

Each of these regions had relatively high rental value increases between March 2020 and June 2021.
This includes a 22.4% uplift across the Noosa Hinterland, an increase of 22.0% across the Richmond Valley Coastal region, and a 19.1% increase across the
Gold Coast Hinterland.
Interestingly, the latest CoreLogic home value index results show that dwelling value and rent growth across the regions shows no sign of slowing just yet.
Over November, dwelling values in regional Australia increased a further 2.2%, up from 1.9% in the previous month, and twice the monthly growth rate
of capital city markets in November.
The rolling quarterly growth chart below shows that unlike historic periods where a loss of momentum across the capitals was matched by an easing
of growth in regional Australia, there is a clear divergence
occurring across the two markets.
Figure 3 shows the remarkably divergent trends between quarterly growth in combined capital city values and combined regional Australia.
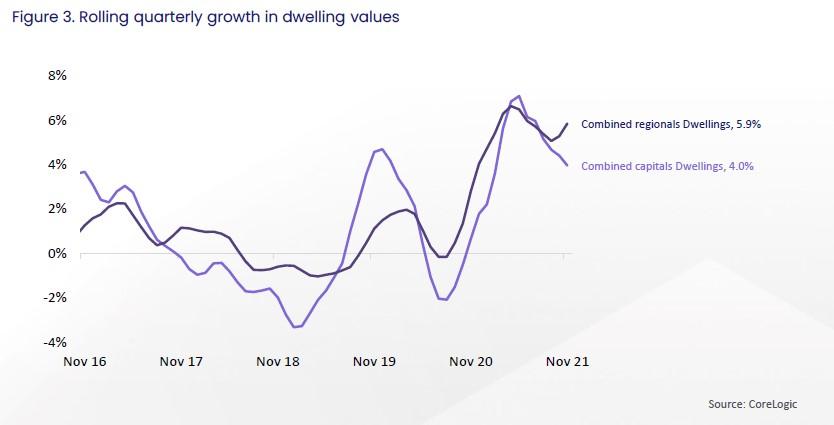
This may be the result of a flurry of activity as the major cities of Sydney and Melbourne have come out of lockdowns.
A similar trend was seen in the March 2021 quarter, where eased social distancing and travel restrictions saw a surge in migration to the regions.
This suggests that in the coming months, regional Australia may be subject to disproportionate increases in affordability constraints.